

An attempt at quantifying New Year’s Resolutions
This new year I wanted to try to track how well people followed through with their New Year’s Resolutions. I attempted to do the same last year by pulling the number of certain hashtags from Instagram but I wanted to expand on that.
I’m currently in the process of going through a 30-day yoga challenge on YouTube. In the middle of one of the videos I thought, why not look at the number of views throughout the 30 days? Since many of these series are posted on New Years Day or people start them on New Years Day, it might be a good indicator of how many people follow through with their resolutions. Even if they are started or posted at a different time of year, I’d wager they follow the same trend since it’s really just tracking how well people stick to new habits.
So, I began to record the number of views of a few 30 day challenges I found on YouTube. All of the ones I found were yoga/fitness related. When picking them out, I made sure each series had a good amount of views, had all 30 days of videos (I did include one that had a few missing), and was specifically made to be a 30-day challenge (not just 30 random videos cobbled together). I ended up finding 8 different series to use.
| channel | 1 | 2 | 3 | ... | 28 | 29 | 30 | |
|---|---|---|---|---|---|---|---|---|
| 0 | adrienne rev yoga | 911531 | 545313 | 429422 | ... | 68497 | 66419 | 62551 |
| 1 | adrienne yoga | 8910198 | 3850409 | 2252723 | ... | 428423 | 404578 | 419763 |
| 2 | adrienne camp | 1795098 | 901061 | 651103 | ... | 150629 | 157835 | 158397 |
| 3 | pilates | 80209 | 46725 | 37091 | ... | 10266 | 8573 | 10069 |
| 4 | hiit | 95189 | 42773 | 50805 | ... | 11964 | 43869 | 17306 |
| 5 | weight loss | 289484 | 98556 | 52952 | ... | 18924 | 6795 | 14210 |
| 6 | do you yoga | 53792 | 23386 | 16617 | ... | 2294 | 2576 | 3272 |
| 7 | fightmaster | 291284 | 108261 | 73509 | ... | 13391 | 12774 | 16571 |
To provide a fair comparison we’ll have to normalize the data to the first value. This way we can compare the percentage of people continuing at each day. Plotting the results we get the following scatter plot and box plot:
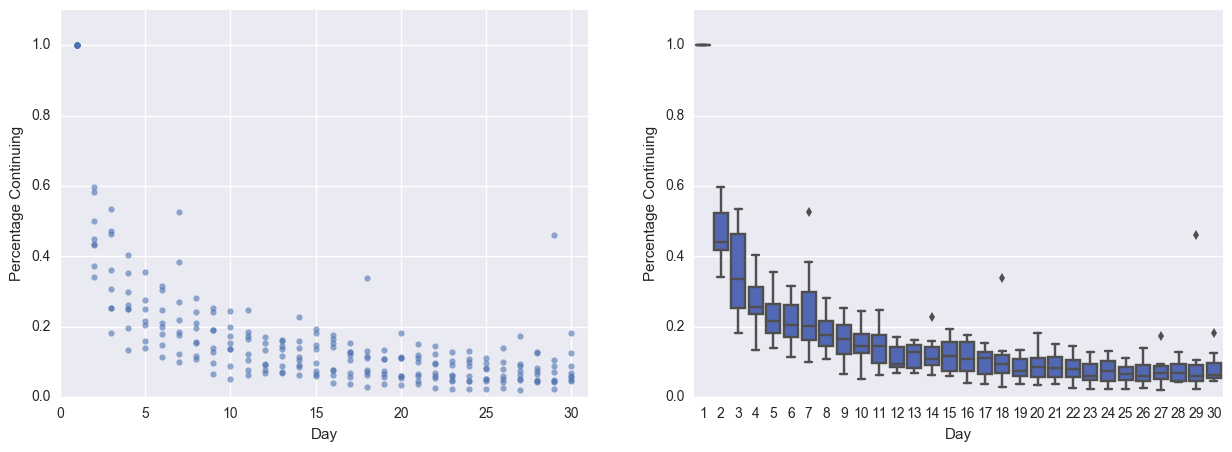
It seems like they all follow the same trend with a pretty steep drop off.
I mentioned in the beginning I tried doing something similar with Instagram. I saw a few friends were doing the 365 photo a day challenge. The goal is to post a photo each day usually using a hashtag like #day42. So I scraped the instagram website to get the total counts for all hashtags from #day1 to #day365.
There are two scatter plots below of the data. One that that shows the number of hashtags throughout the whole year and another showing the same info but just for the first 30 days of the year.
| Day | 1 | 2 | 3 | ... | 363 | 364 | 365 |
|---|---|---|---|---|---|---|---|
| hashtags | 4096062 | 3600835 | 2584125 | ... | 3119 | 4175 | 11866 |
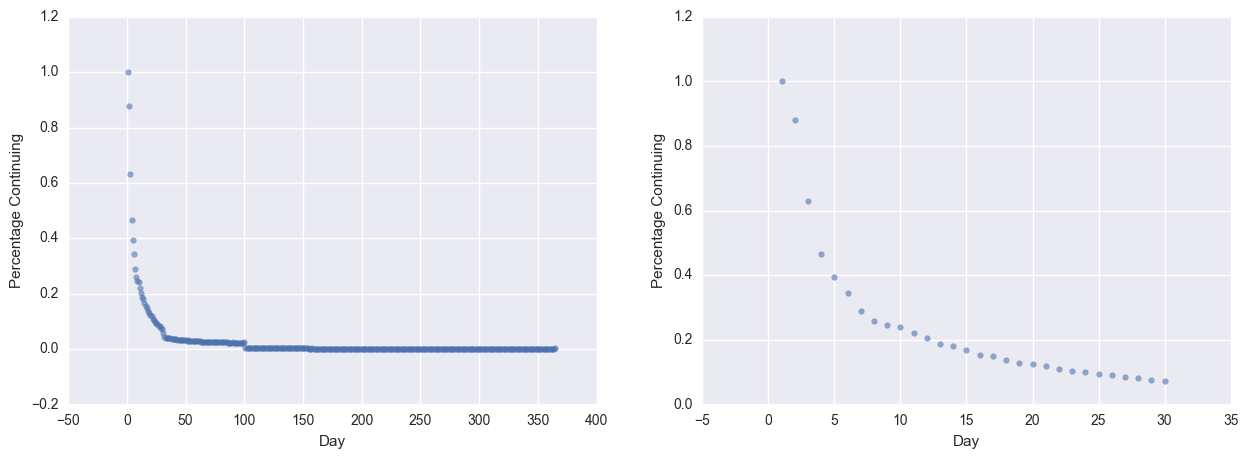
Looking at the plot for the whole year there’s a few strange bumps. I’m guessing maybe this might be because there are other X day challenges due to the drops at 30 and 100. This probably means our data from Instagram is a bit more noisy then the data from Youtube. Plus there’s probably other reasons someone might use a hashtag like #day42 besides some challenge.
Even with that being said there still seems to be trend worth comparing especially from what we can see in the 30 day scatter plot. So let’s normalize it like we did before and compare it to our YouTube data. The data from Instagram is in red.
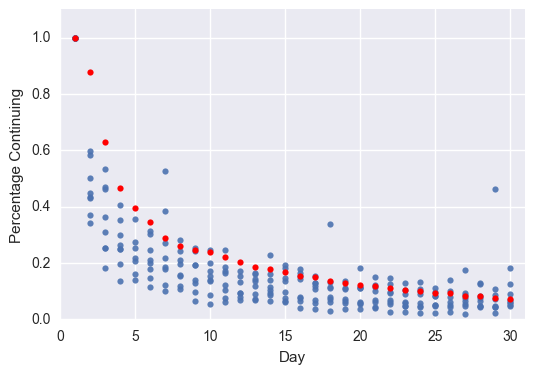
The data from Instagram seem follow the same trend, perhaps more on the forgiving side of things. But overall it seems most people don’t follow through with their New Year’s Resolutions (can’t say I’m too surprised). From our data, it appears only about 10% of people are still sticking to them after 30 days.